the Problem!
Difficult to read
Financial Statements!
Plowing through official fillings
Exhausting to hunt down and search through.
Skimming lots of line items
Brain fog when trying to read between 100’s of line items (that aren’t even properly formatted).
doing the math
Annoying to add up and subtract all the line items.
...and then doing it over and over to compare
Doing this many times over when comparing companies.
the Solution!
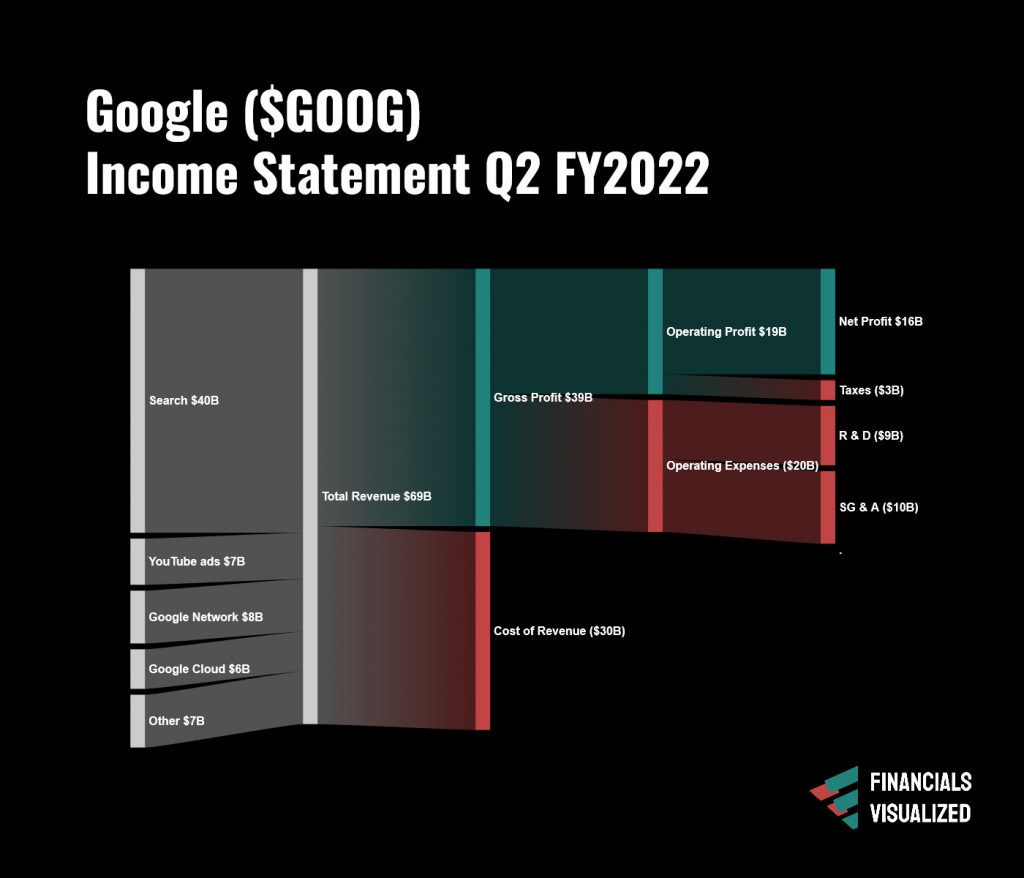
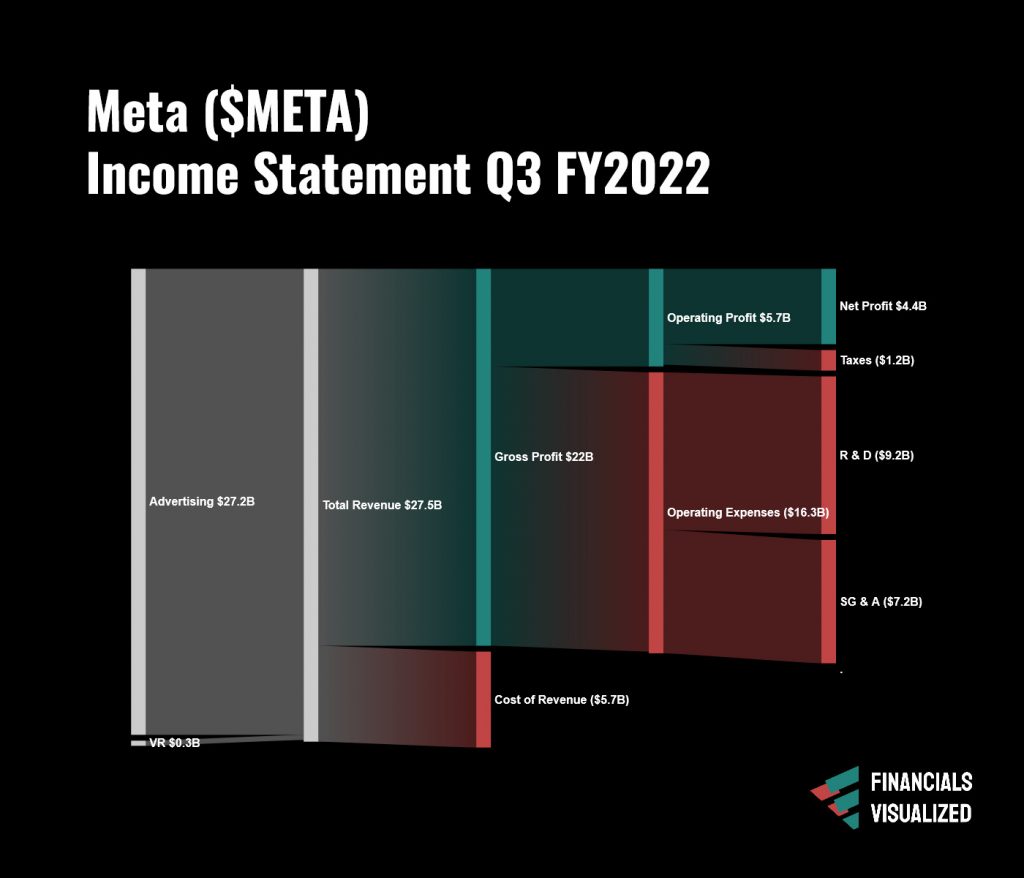
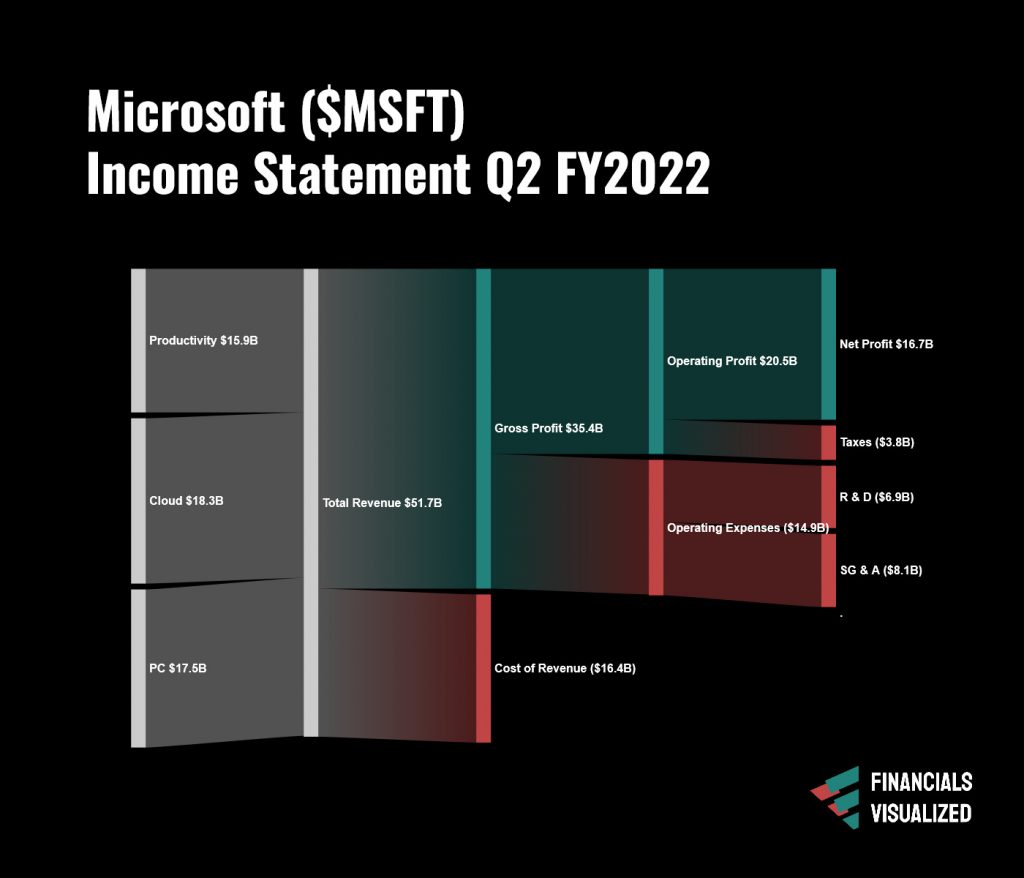
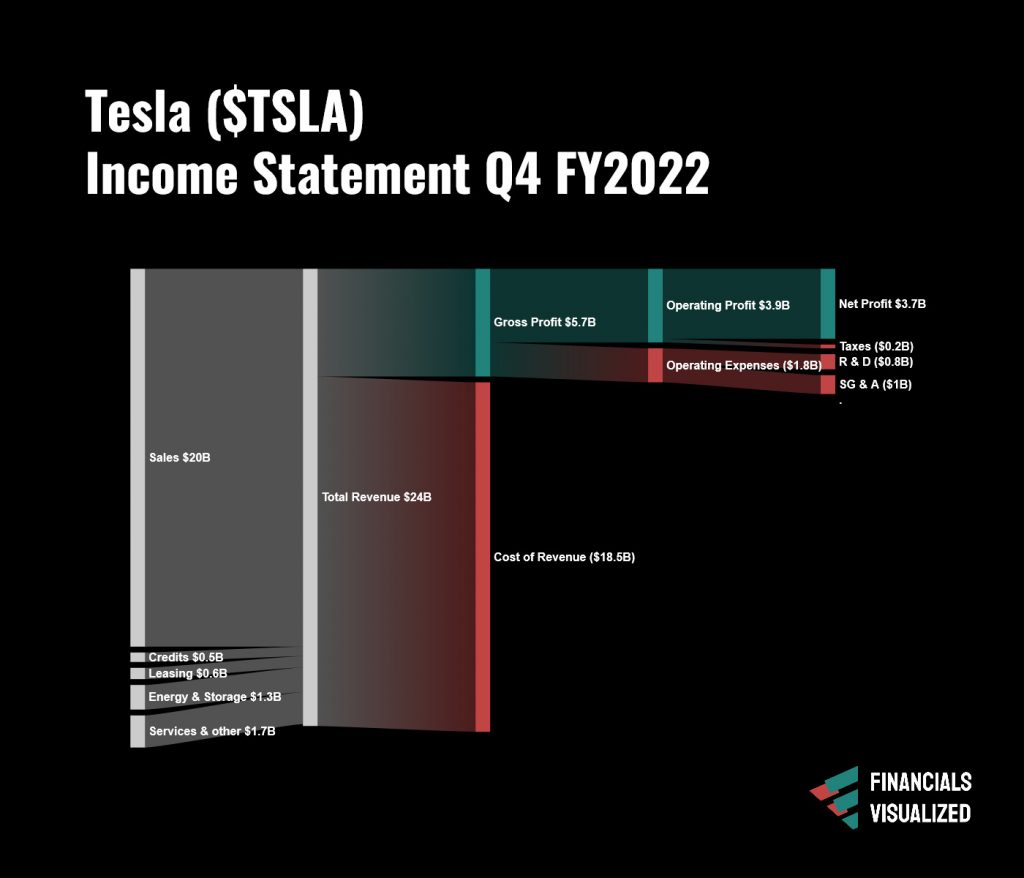
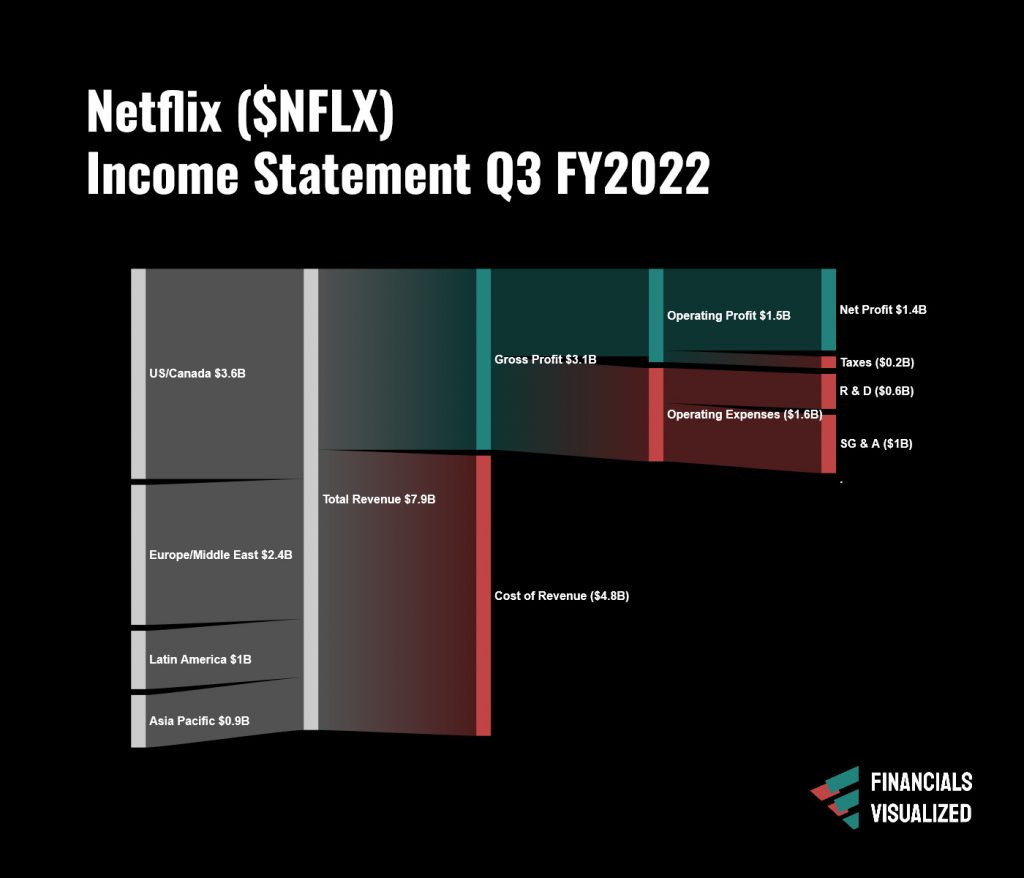
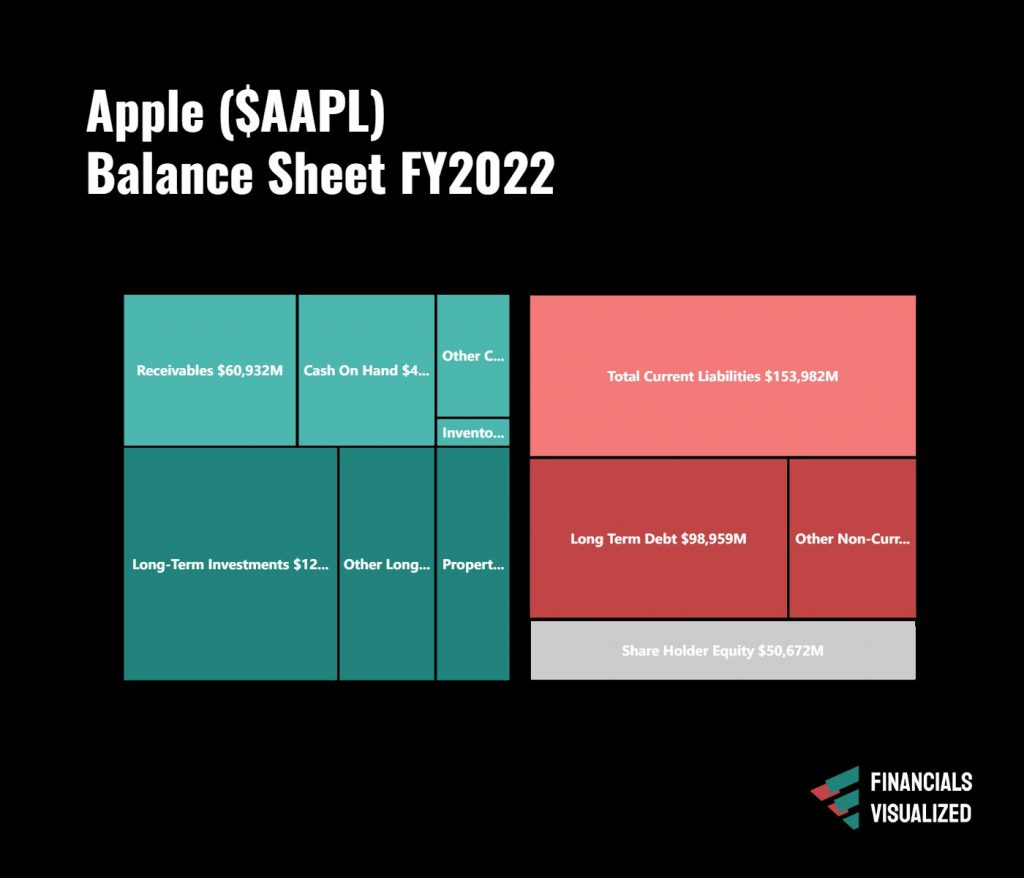
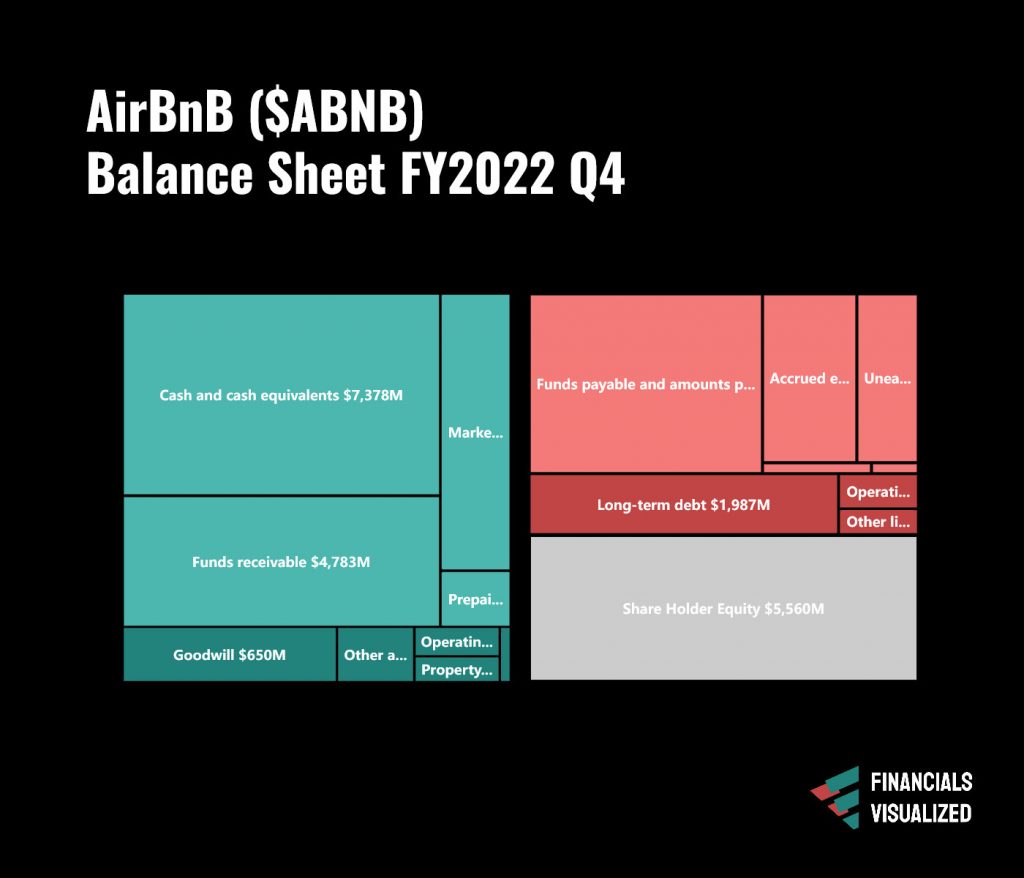
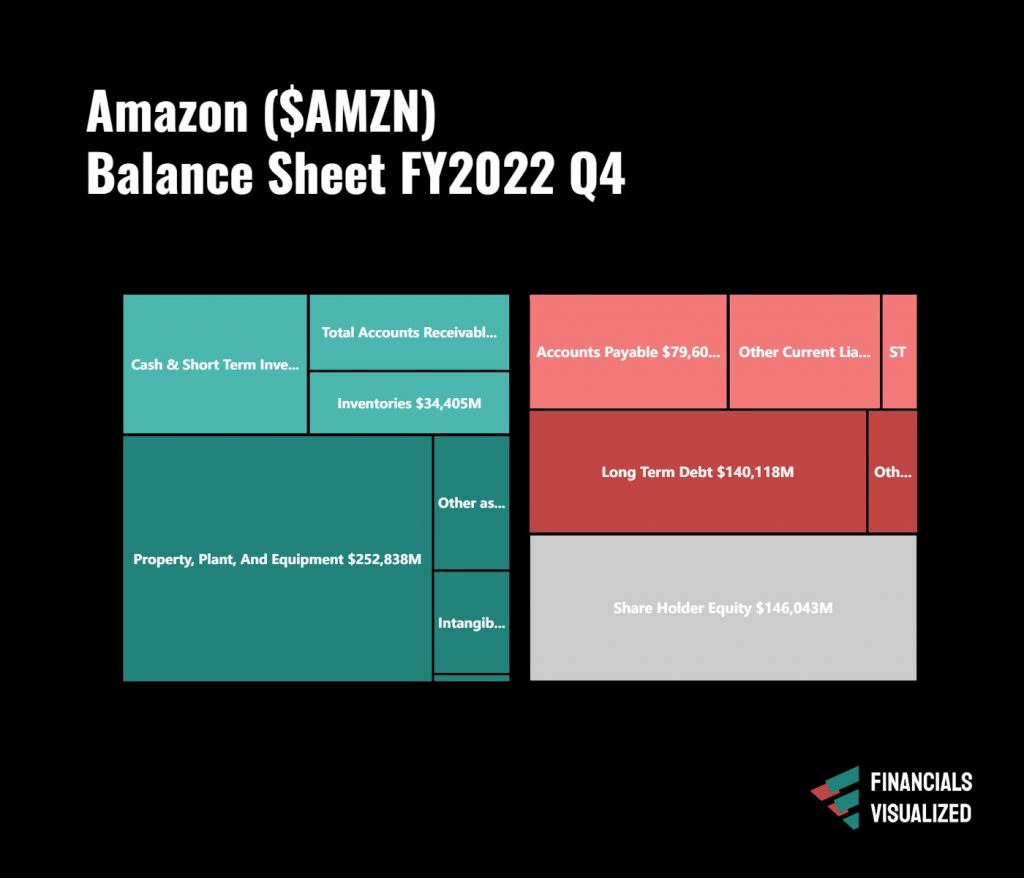
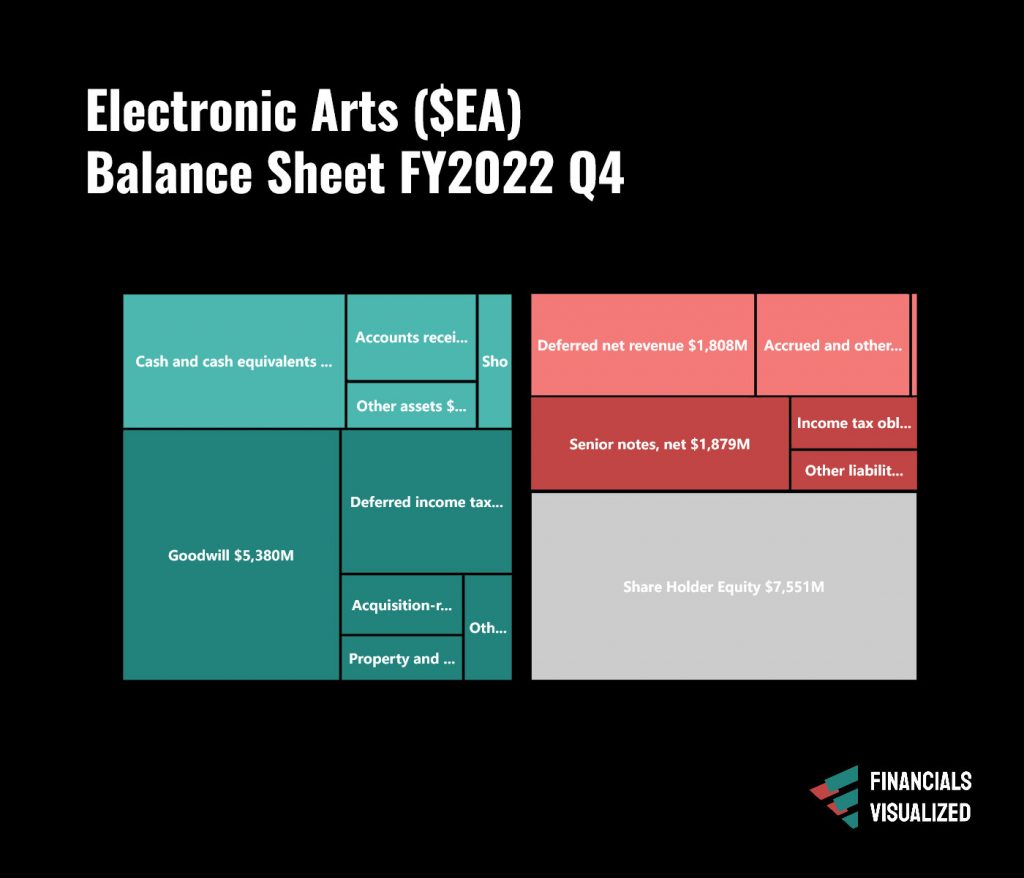
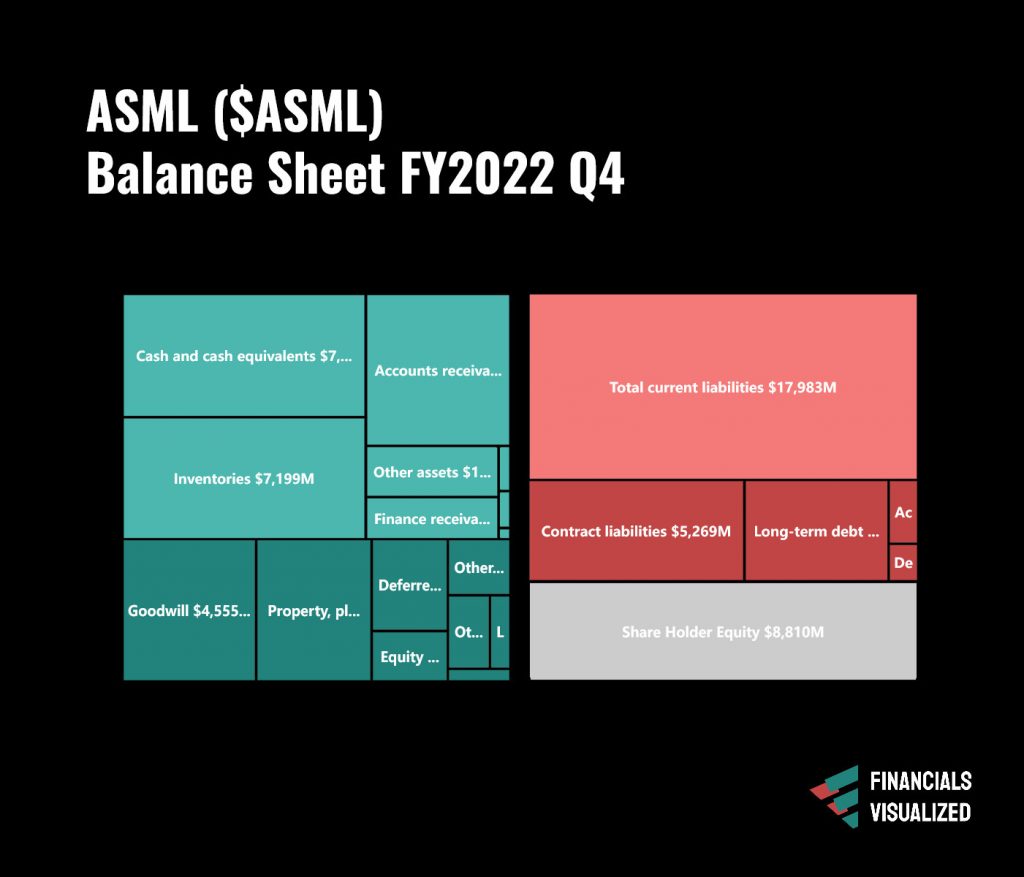
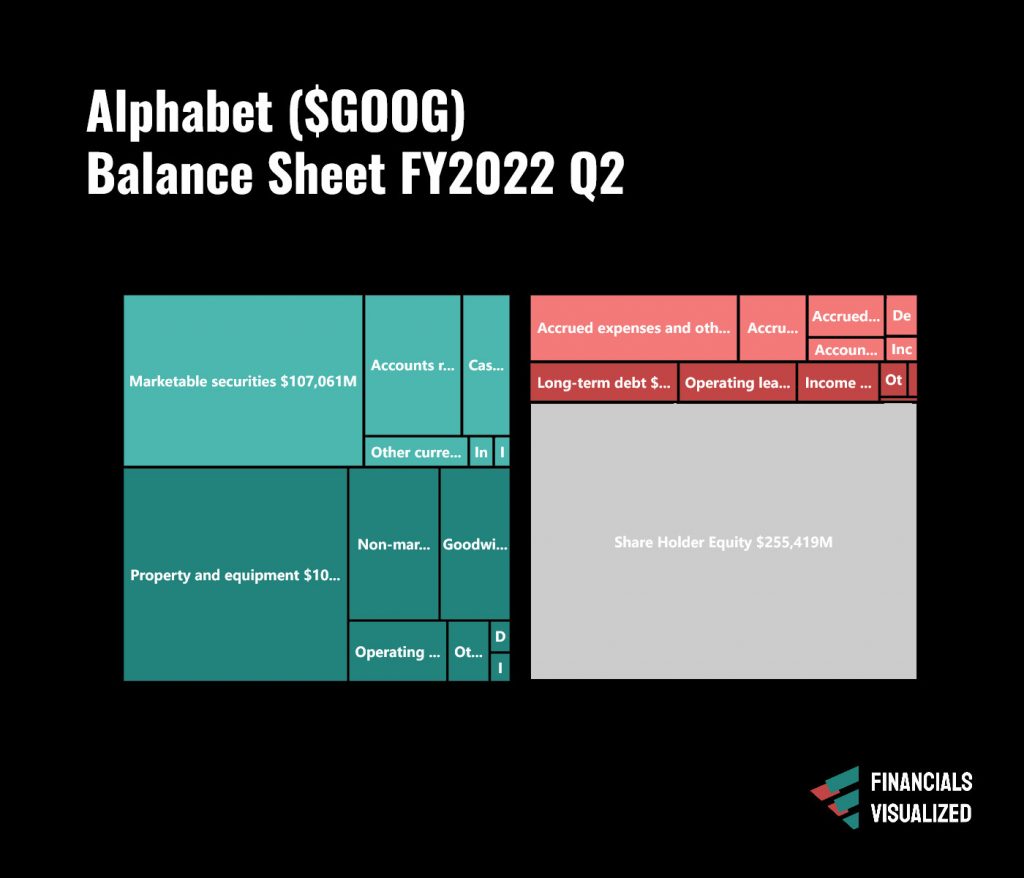
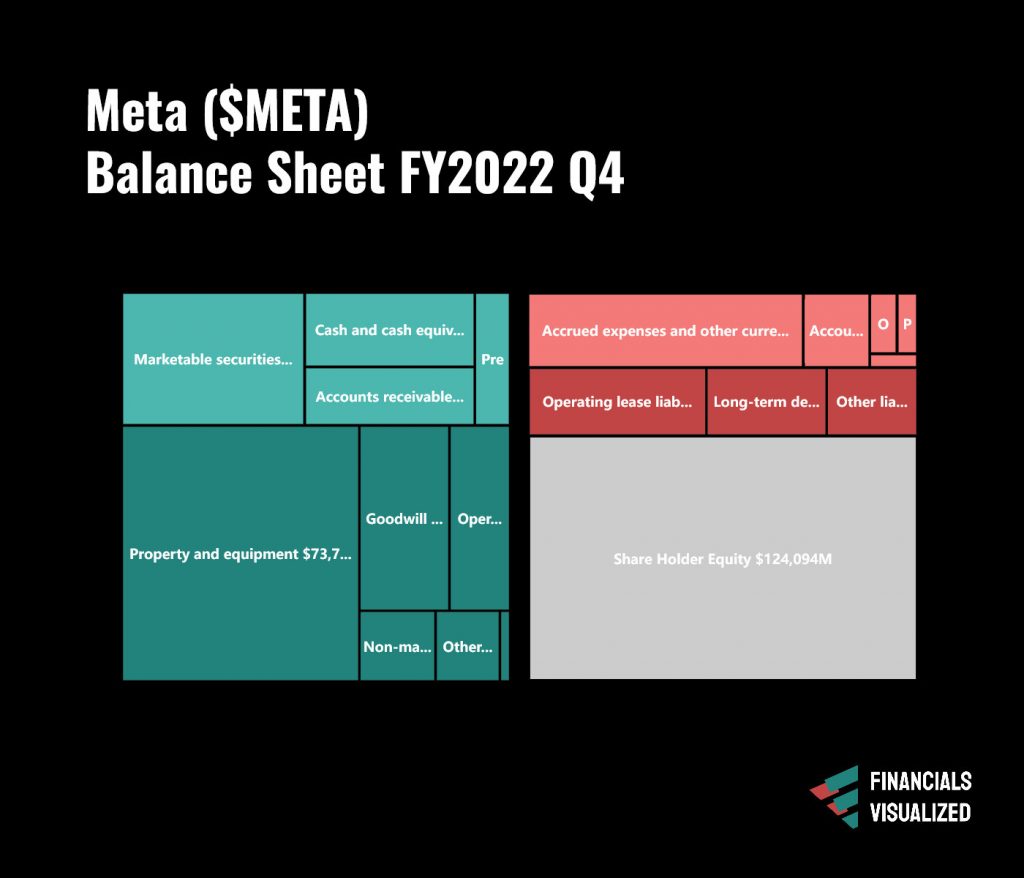
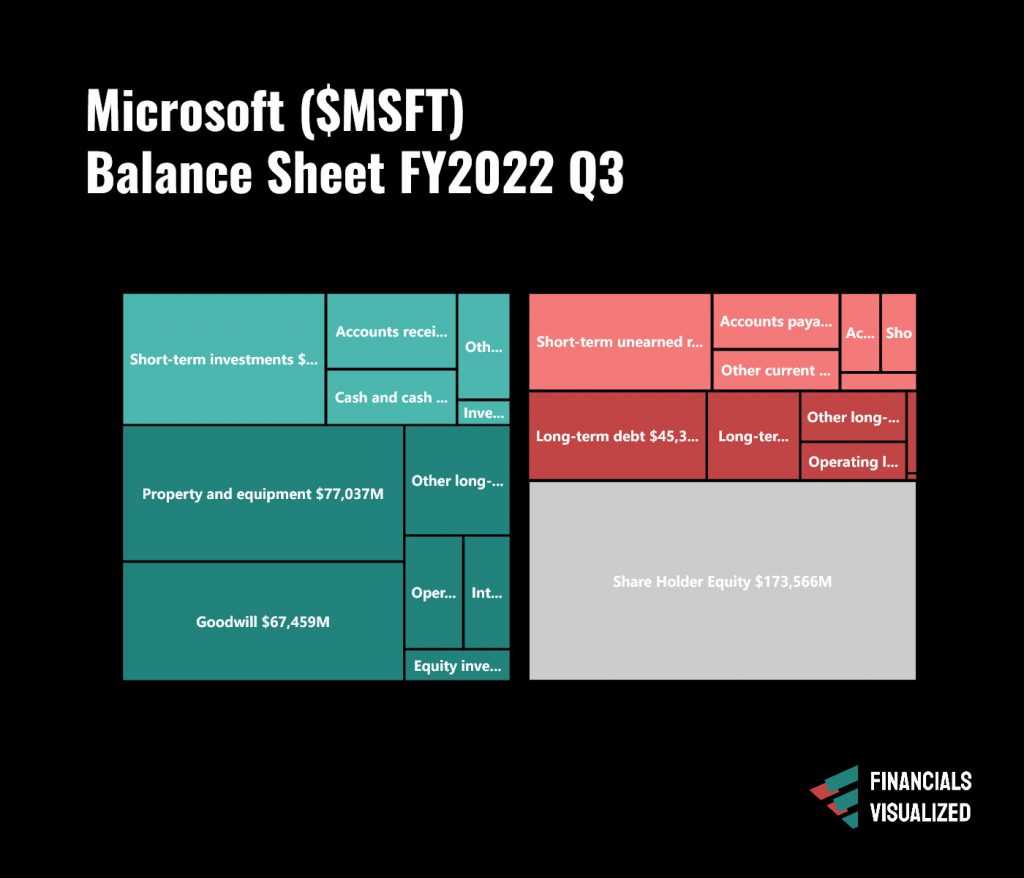
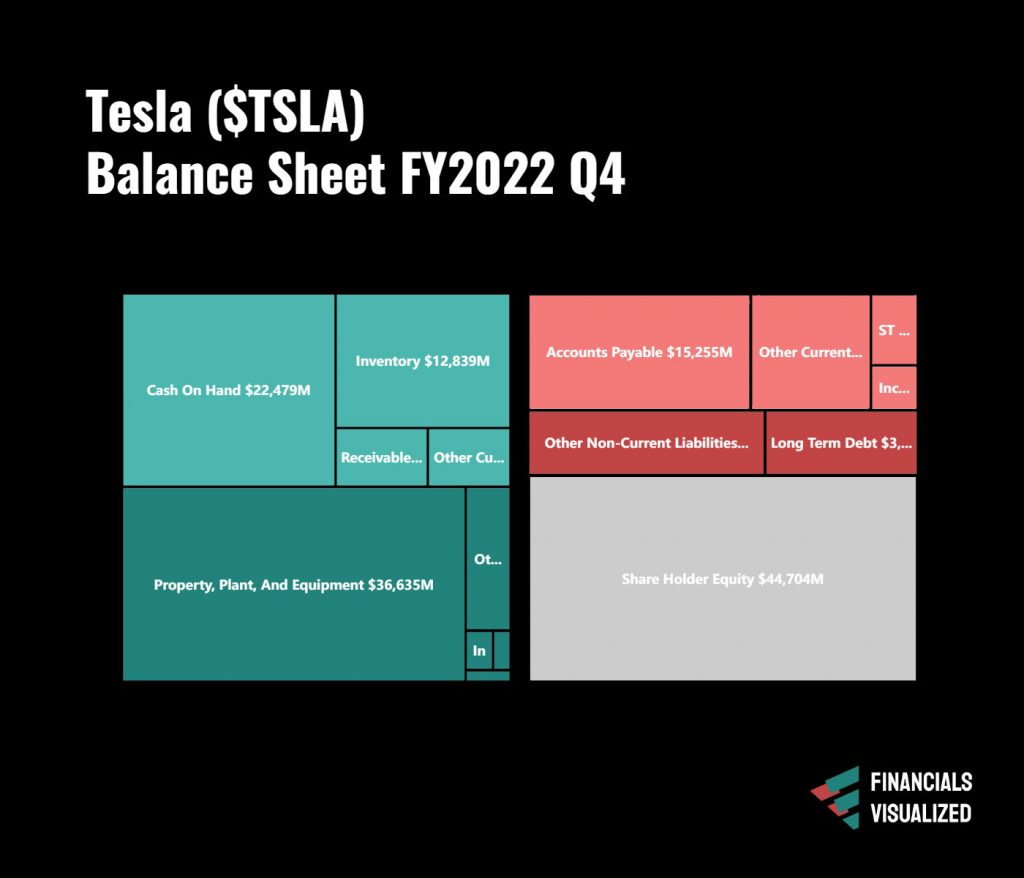
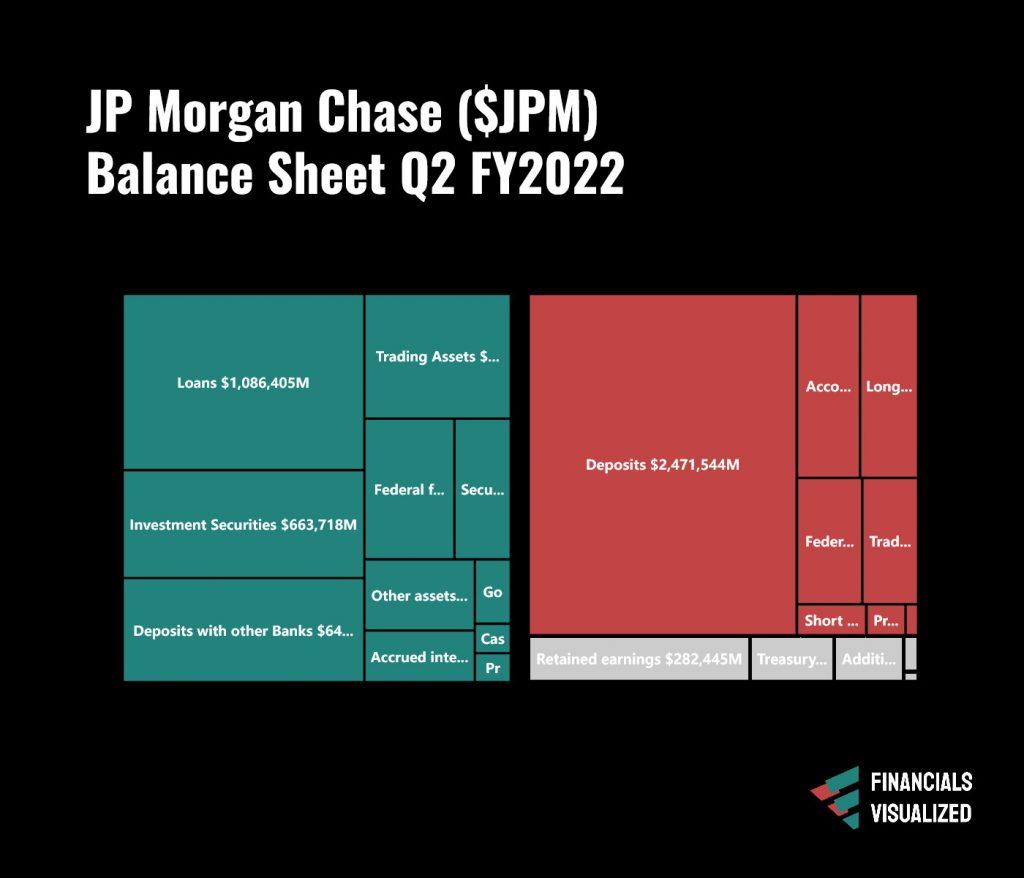
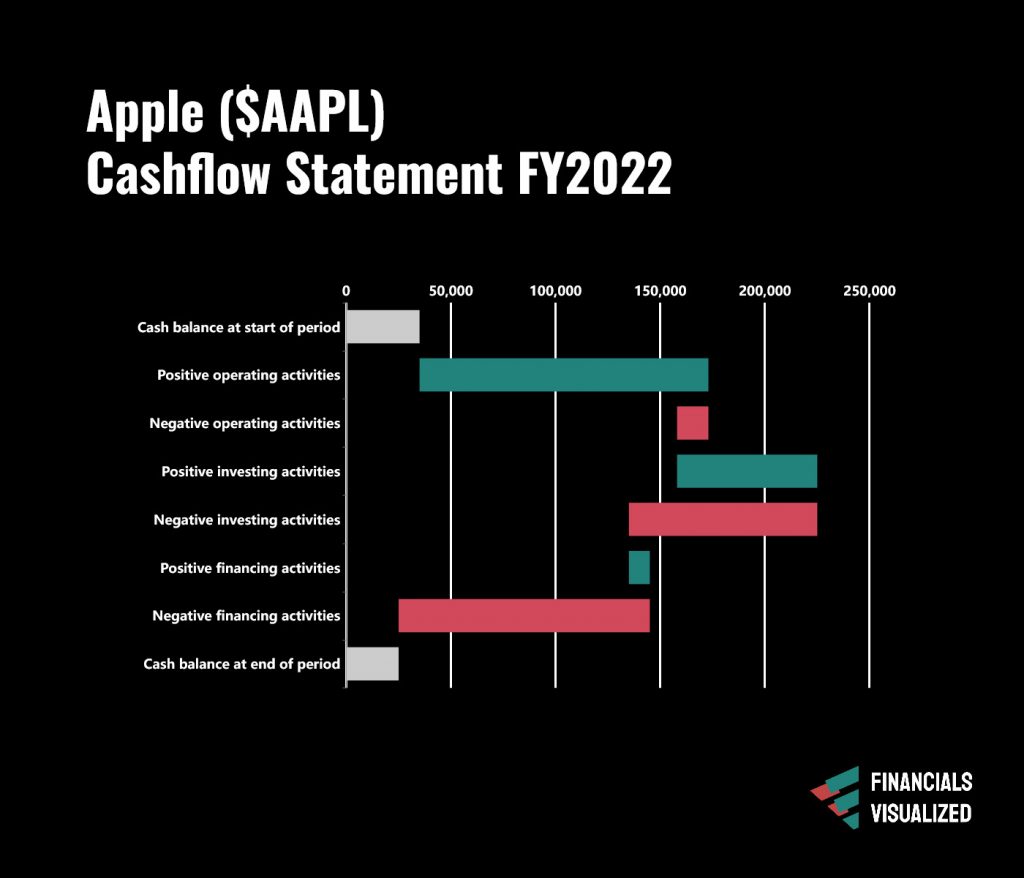
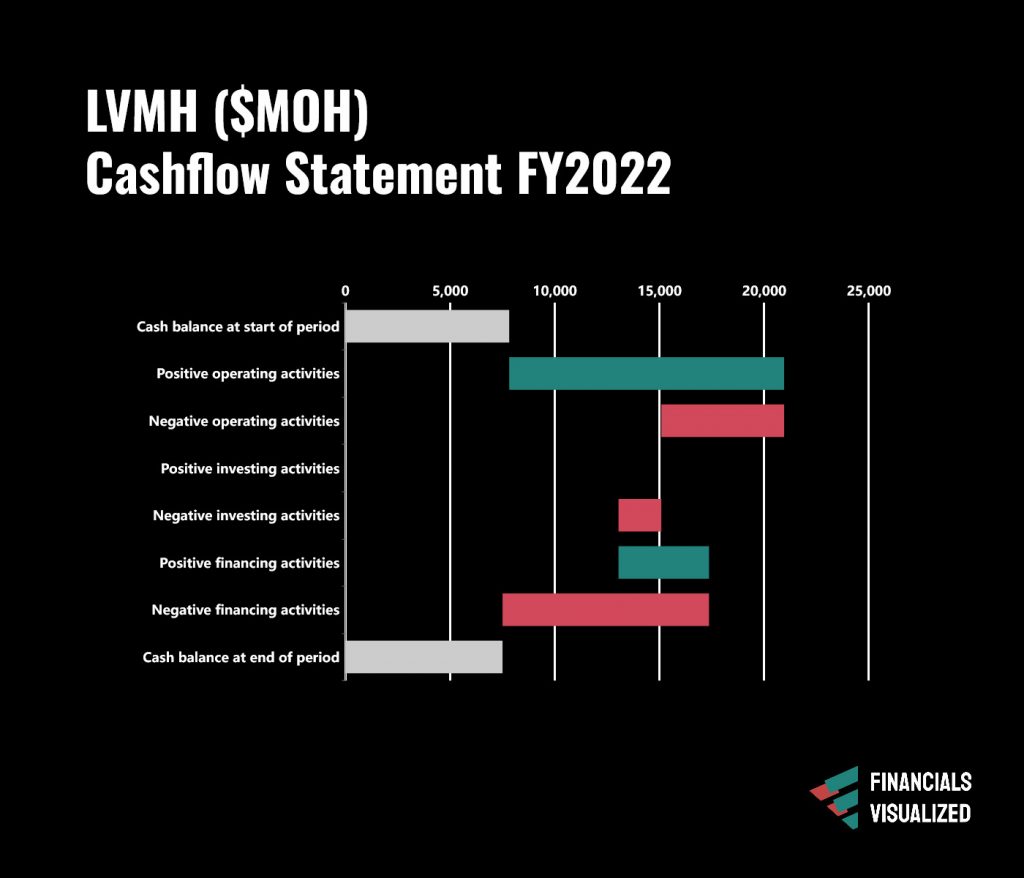
Easy to read charts!
Up to 60x faster understanding
We process visual information up to 60x faster than written information.
Quicker decisions
Spent less time on assessing if a company is worth your attention.
Quality investments
Filter through your investment candidates faster to get to the best ones.
More ease
Much less cognitive load thanks to intuitive visuals.
How it works
$Ticker in – Charts out

Put in stock ticker
Simply type in your stock ticker, like AAPL for Apple, TSLA for Tesla or META for Meta/Facebook or the company’s name. You can even add a bunch of them all at once.

+ Pick date
Now select the year that you’d like to retrieve financial data for. You can even define a date range in case you’d like to get the history of the companies you are querrying. Our data goes back up to 30 years.
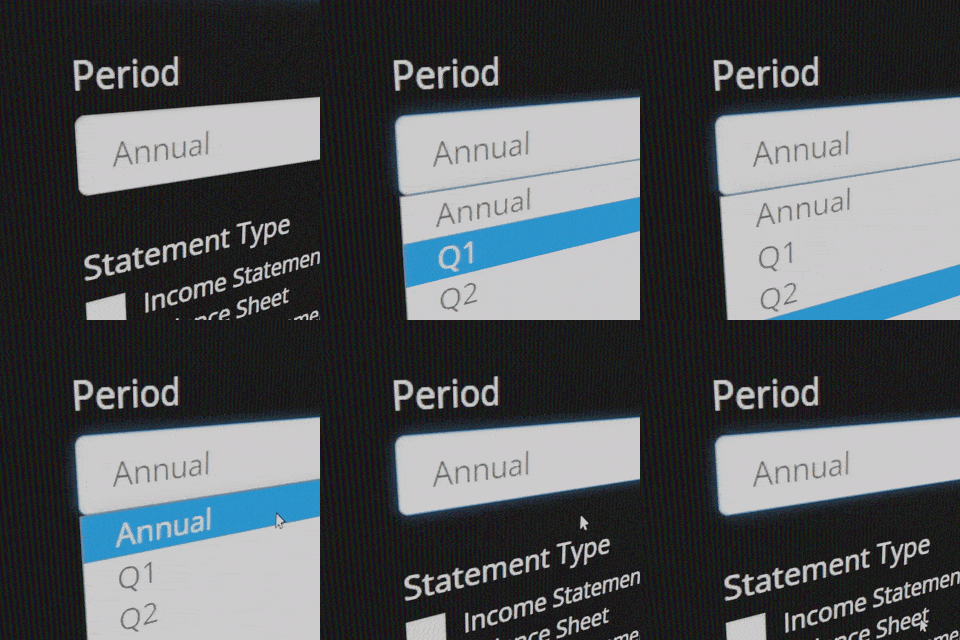
+ Select annually or quarterly
Now pick the annual option or select the individual quarter. Here you can compare quarter over quarter performance when selecting a quarter over many years.
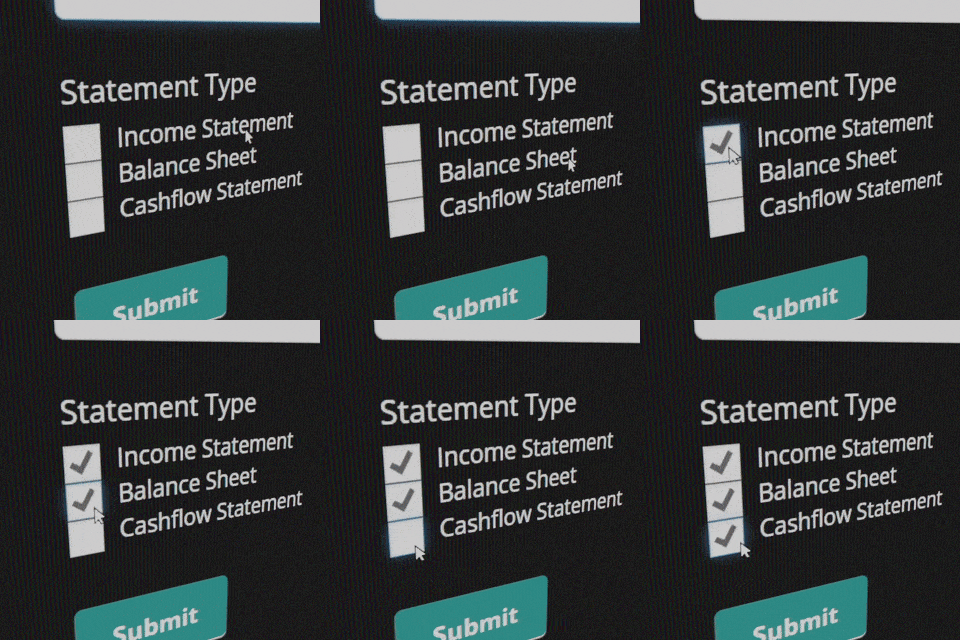
+ Select Statement Types
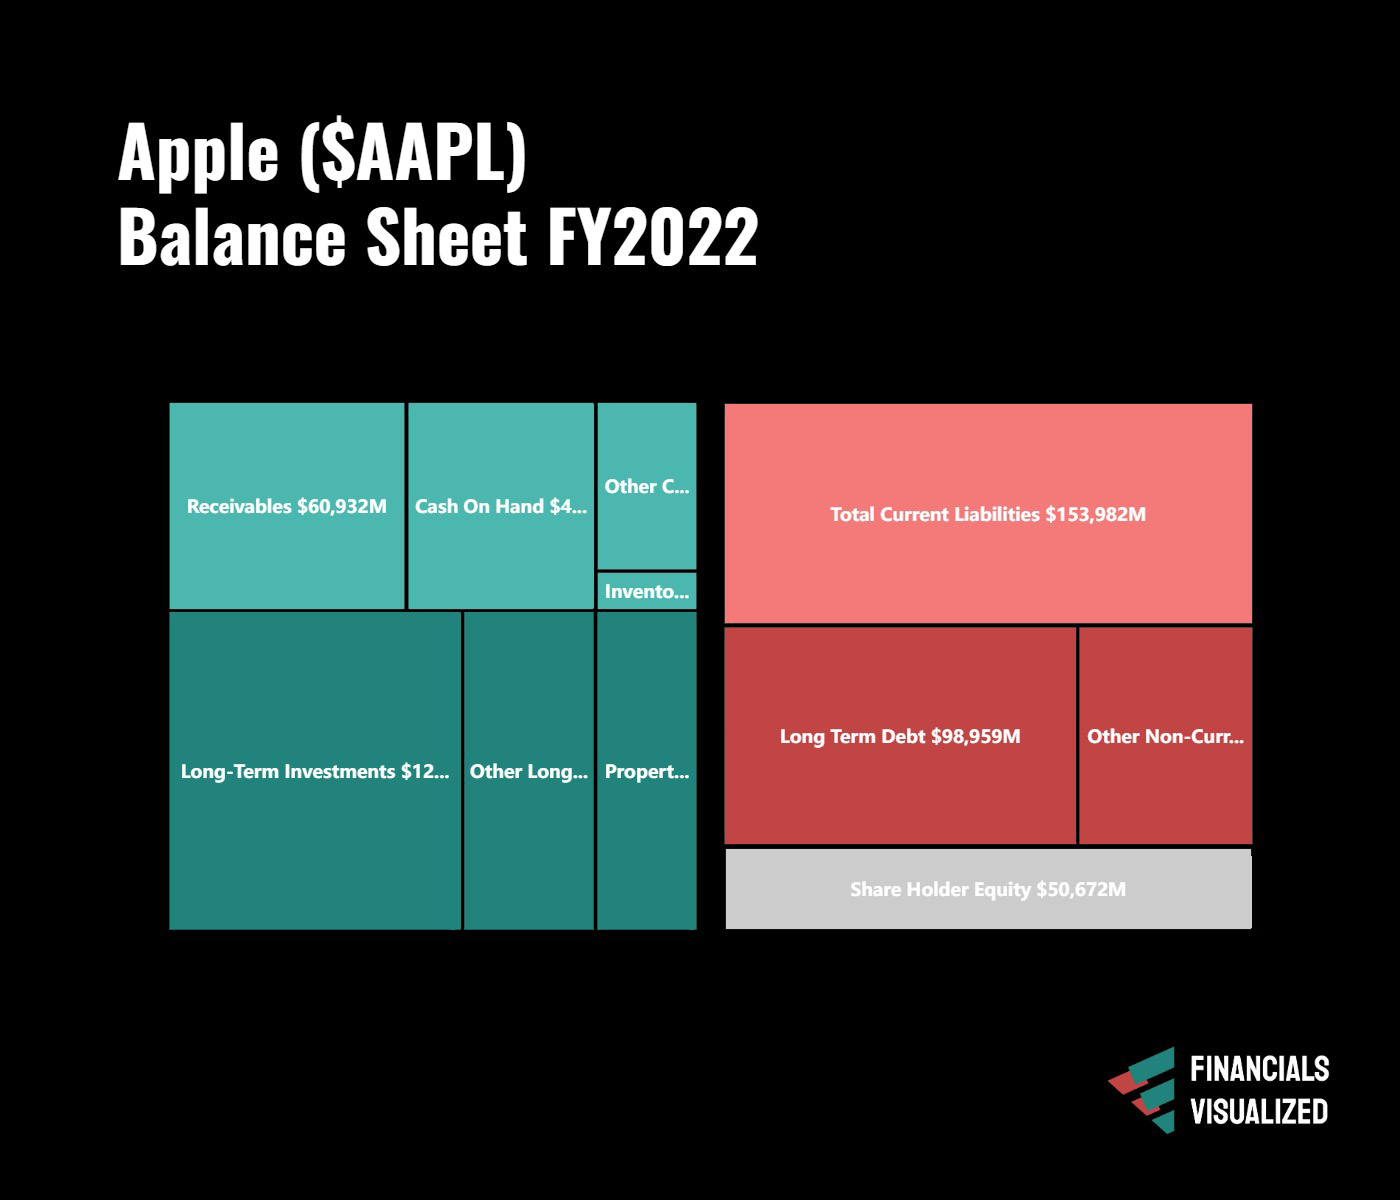
Finally decide on which of the three financial statements, income statement, balance sheet or the cashflow statement you’d like to get visualized.
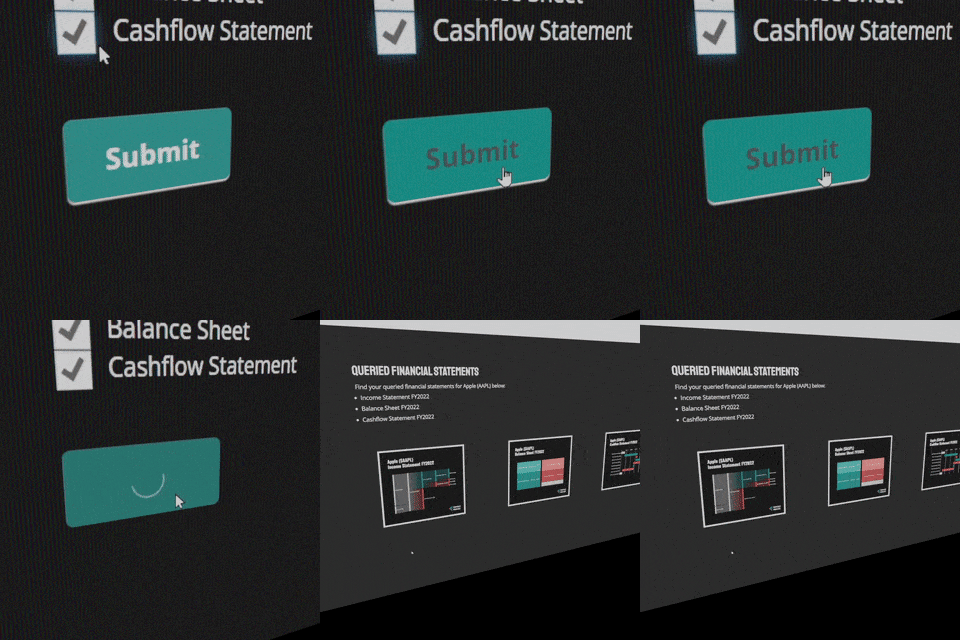
= financial intuition
That’s it. Hit ‘submit’ and get your financials visualized immediately.
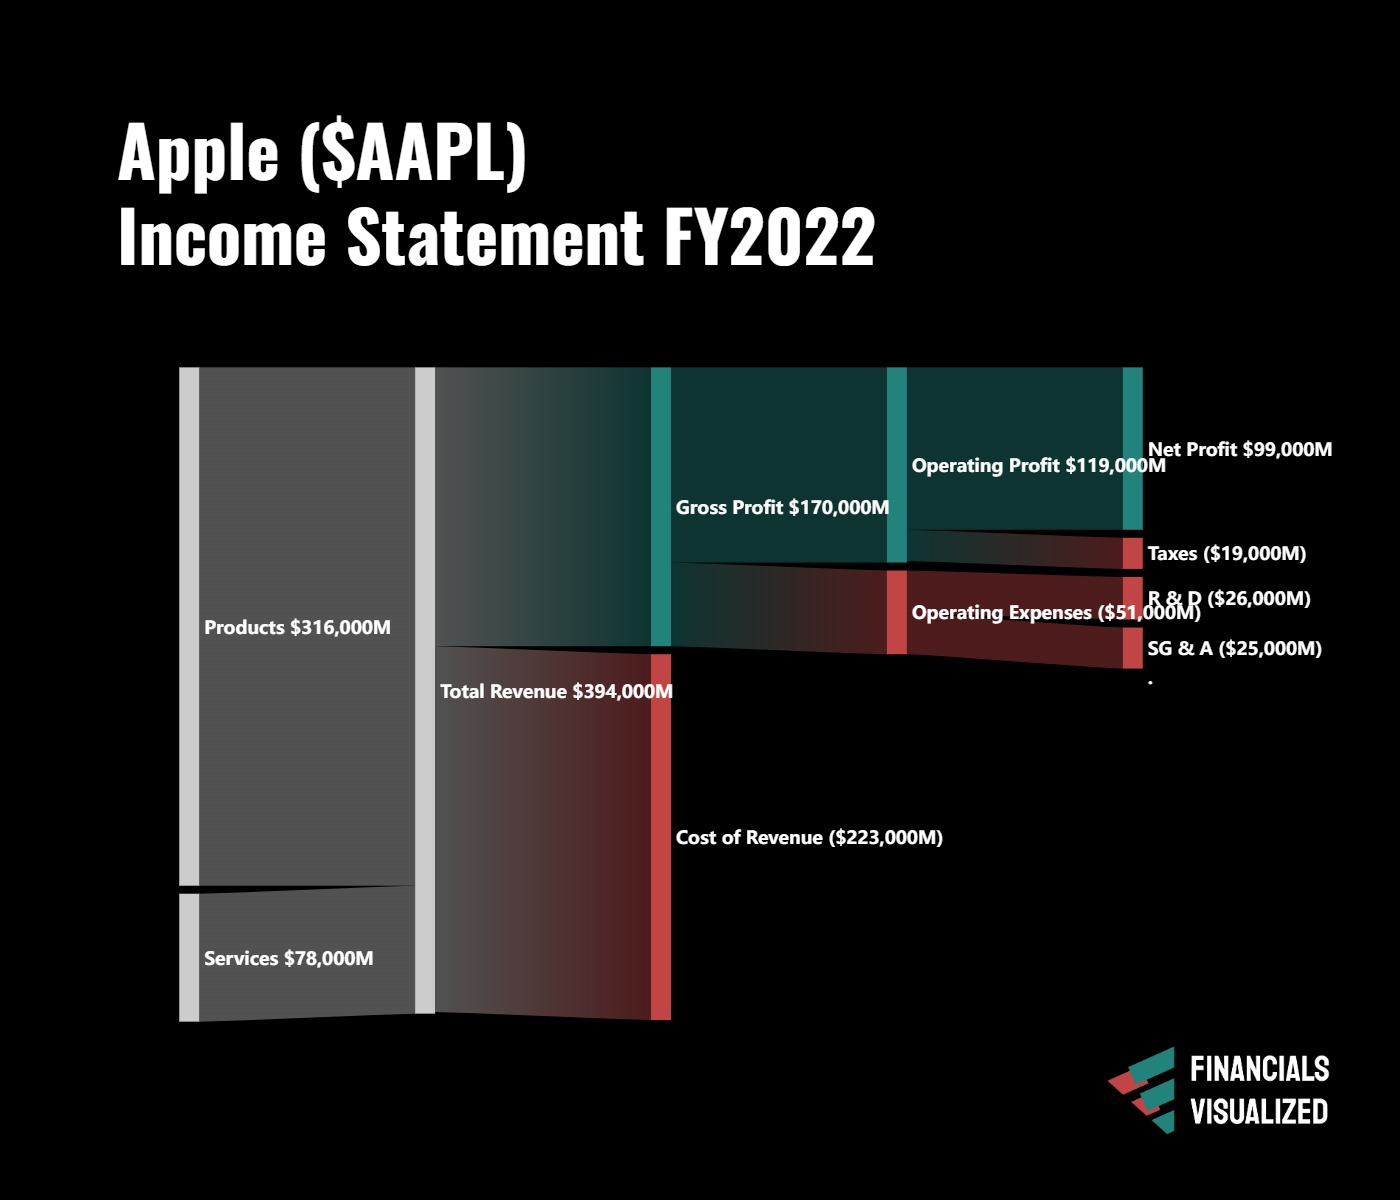
Sample Statements
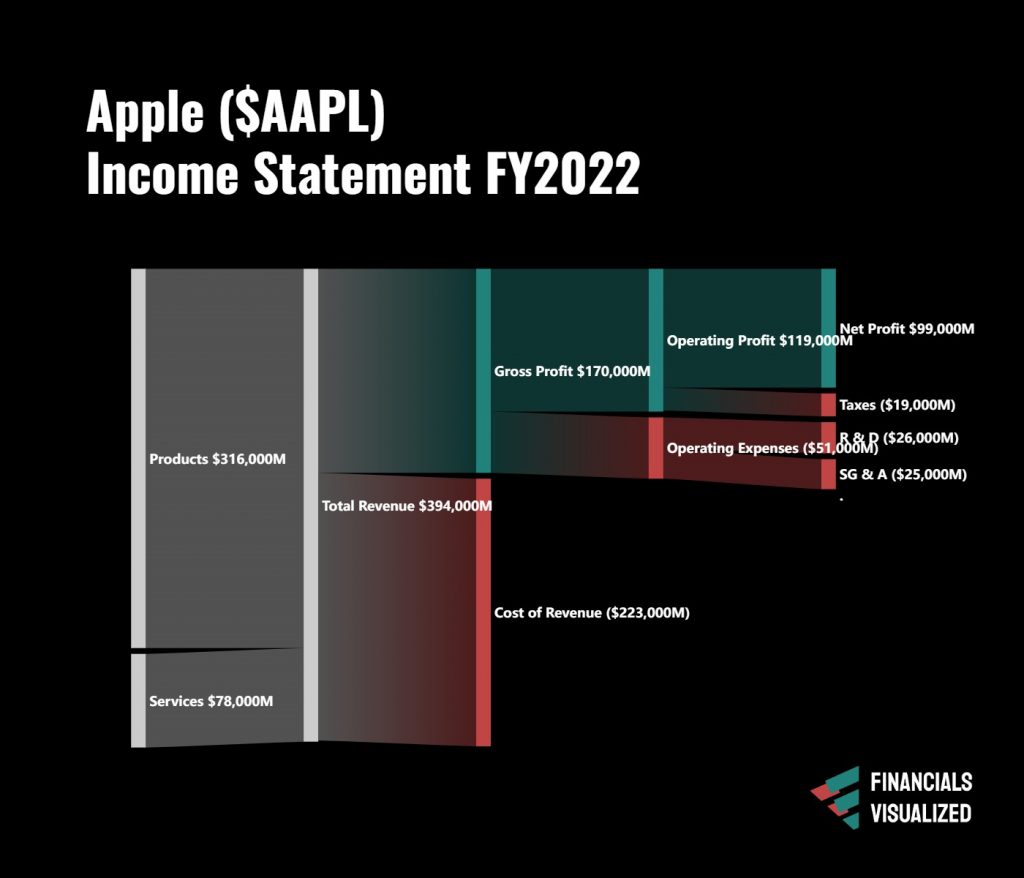
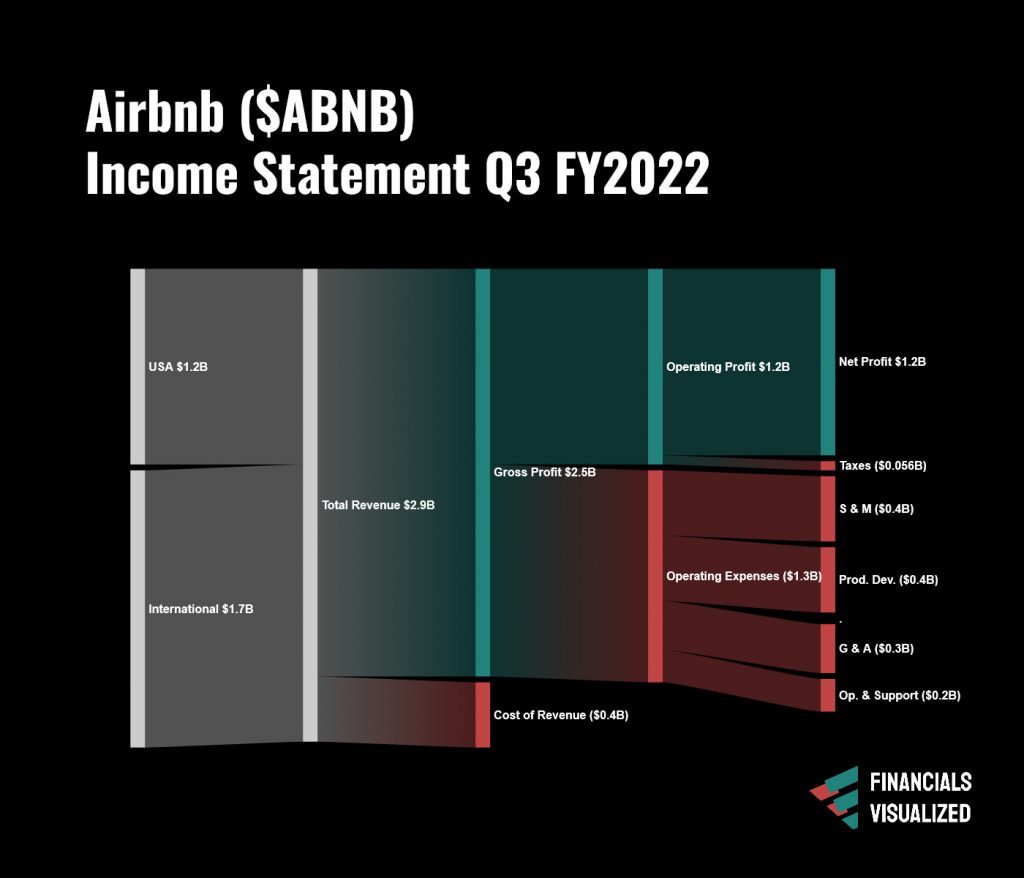
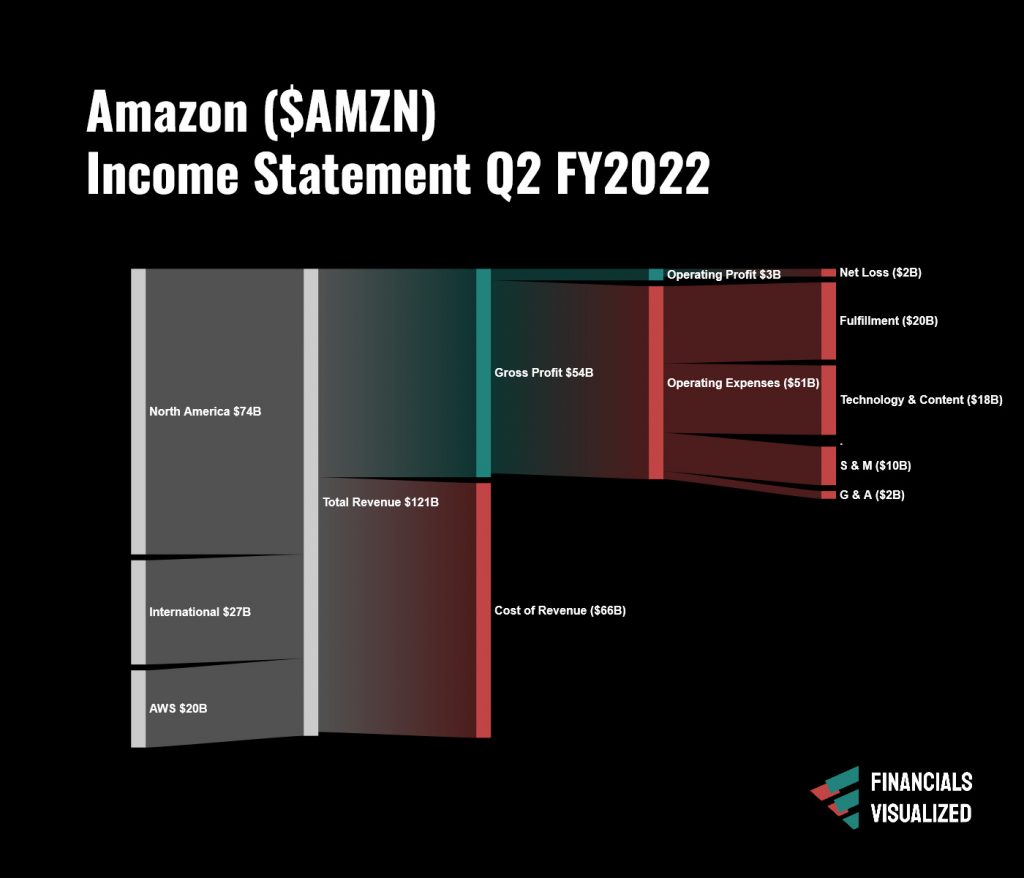
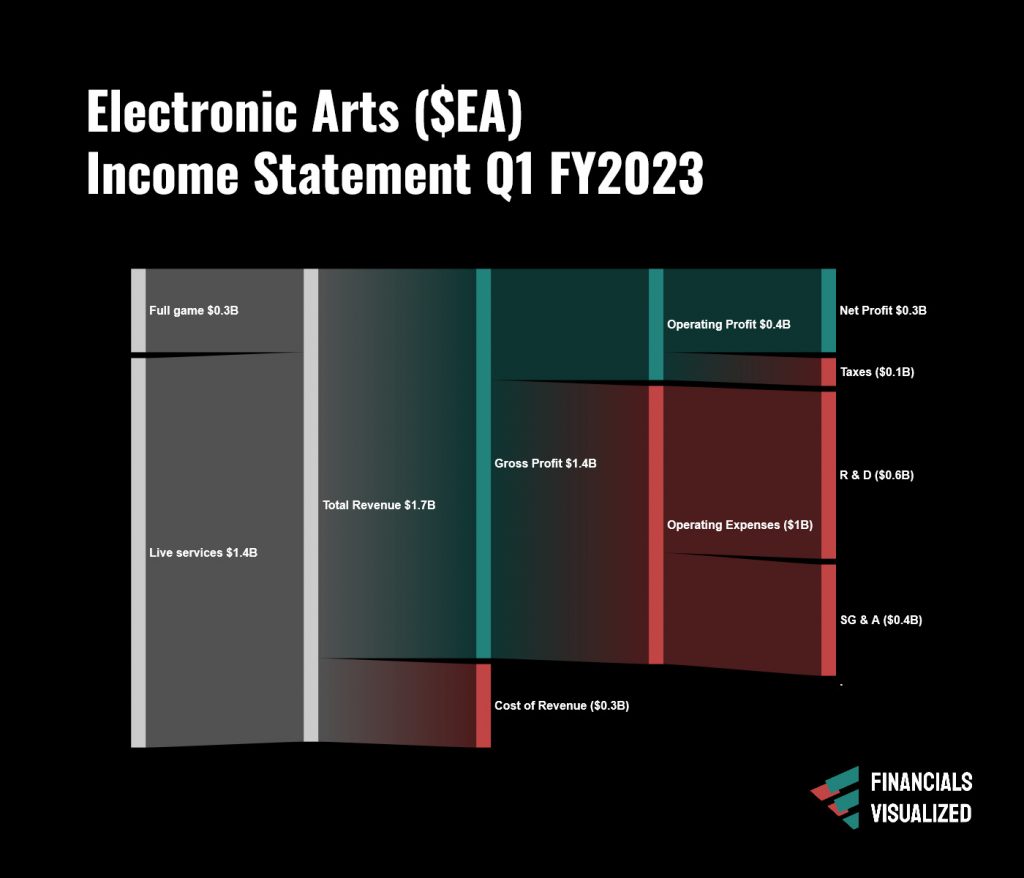
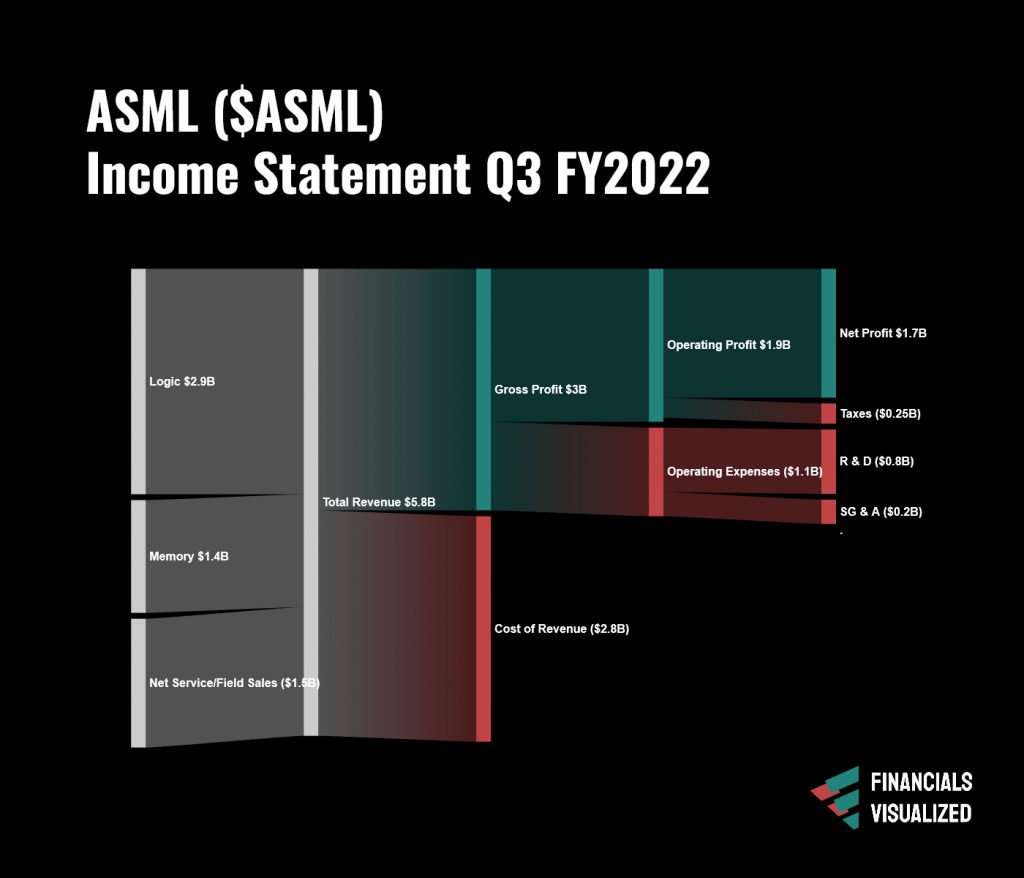
Income Statements
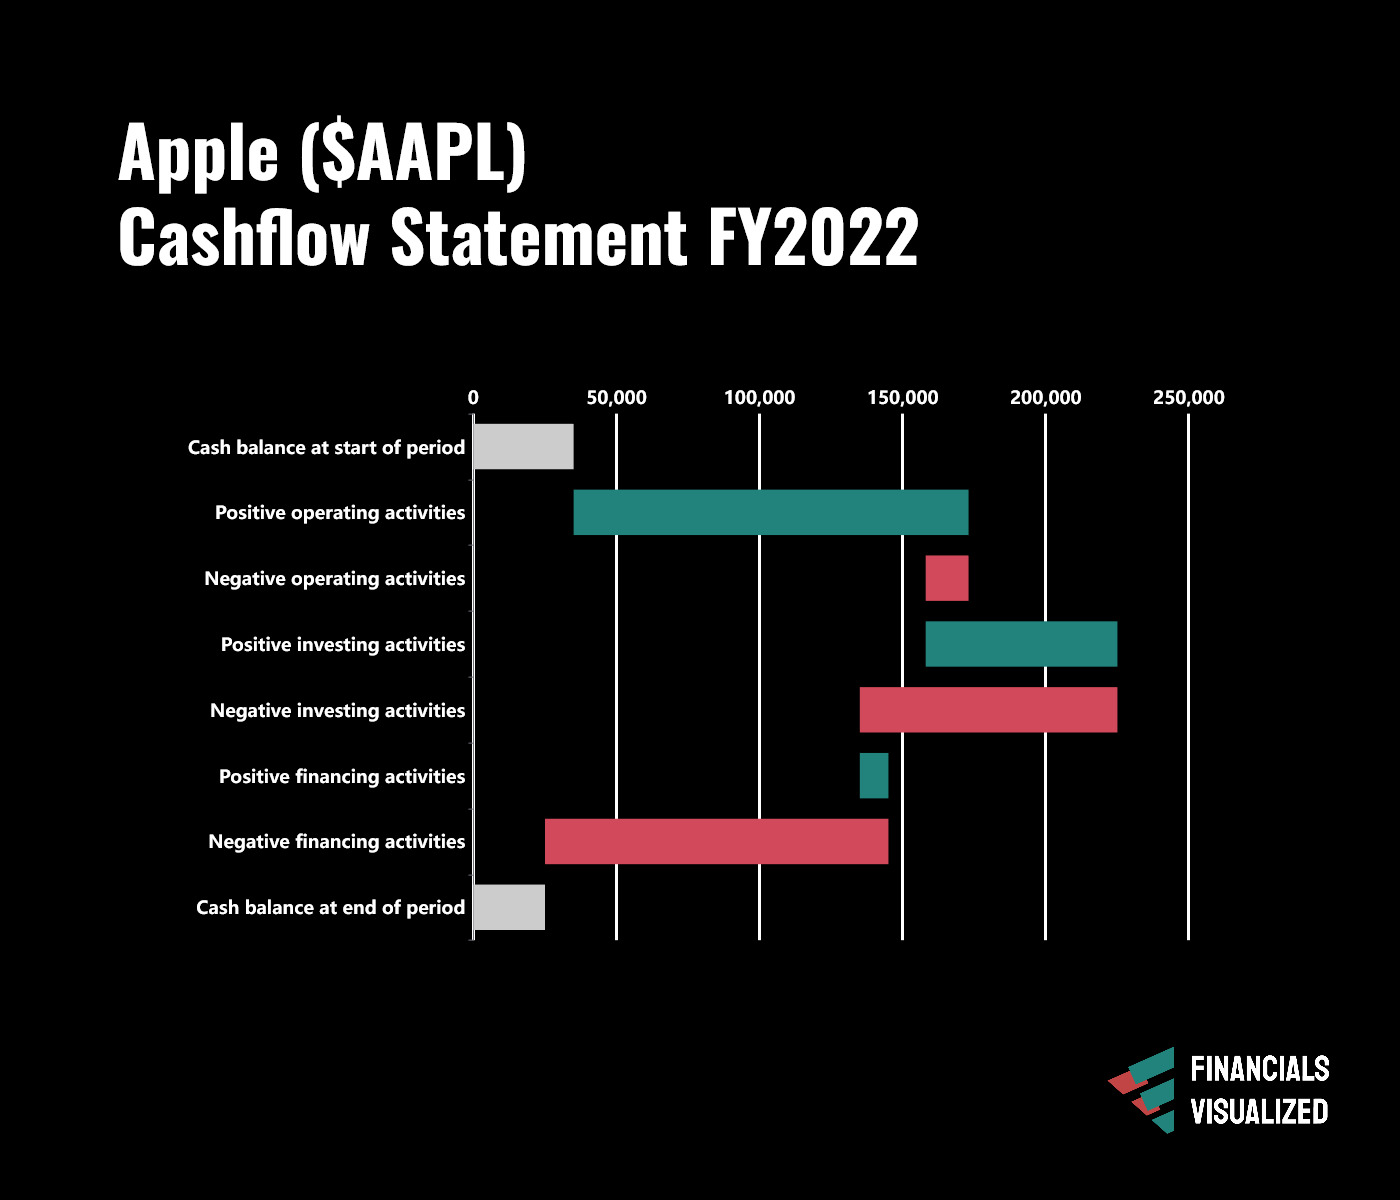
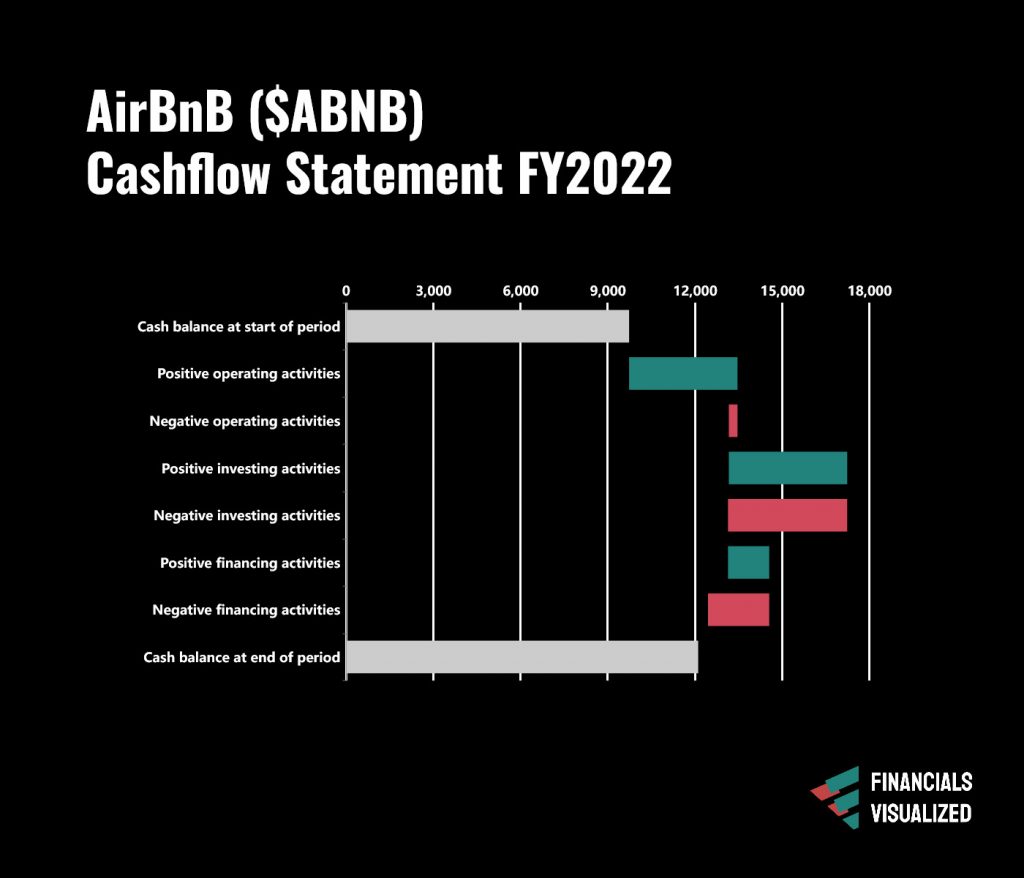
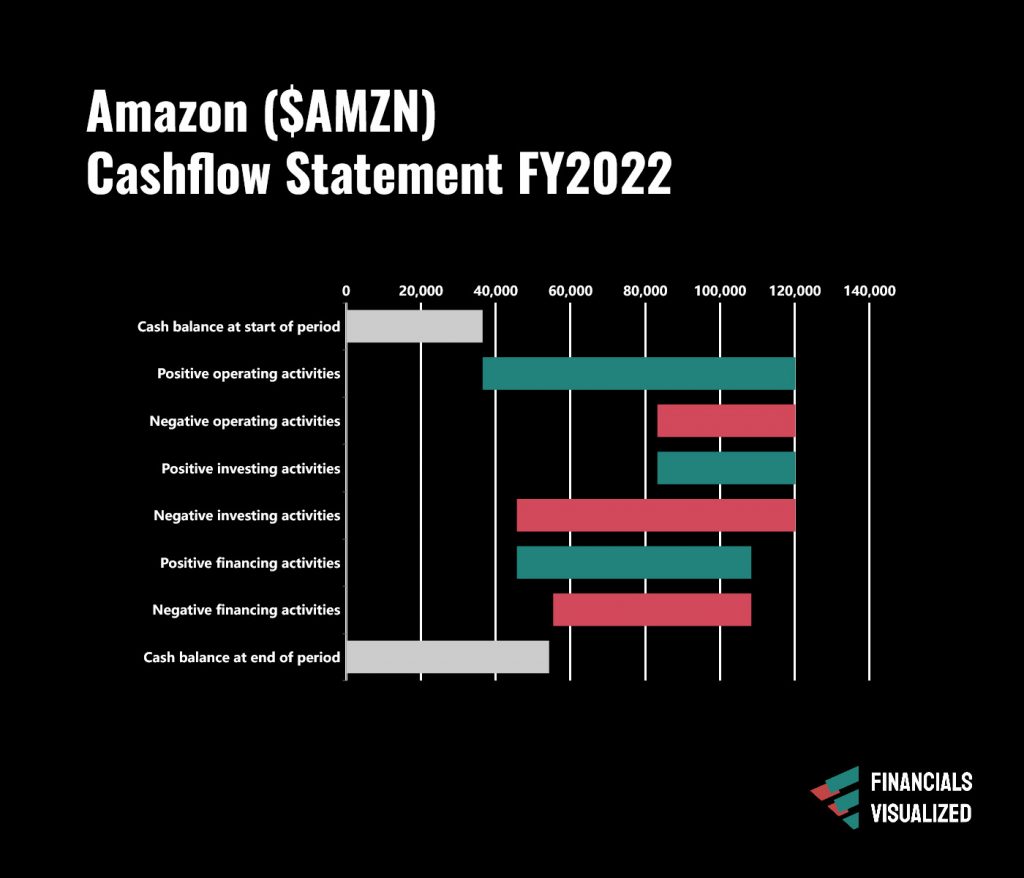
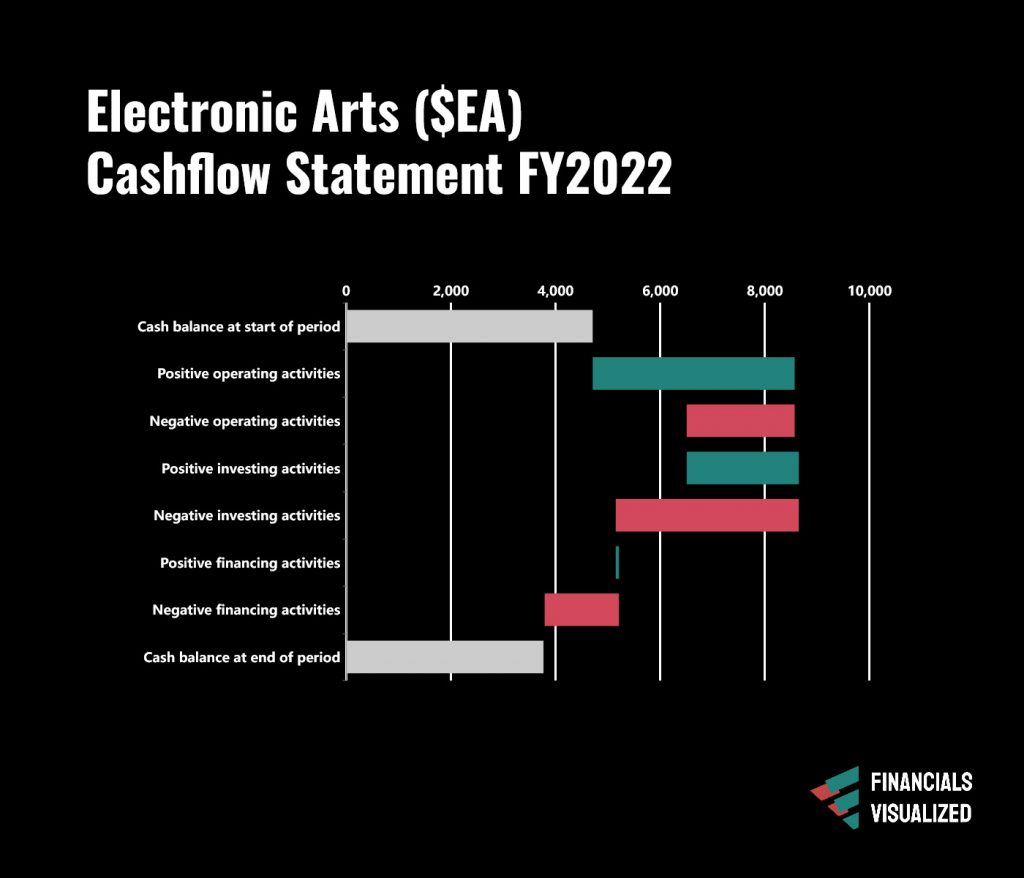
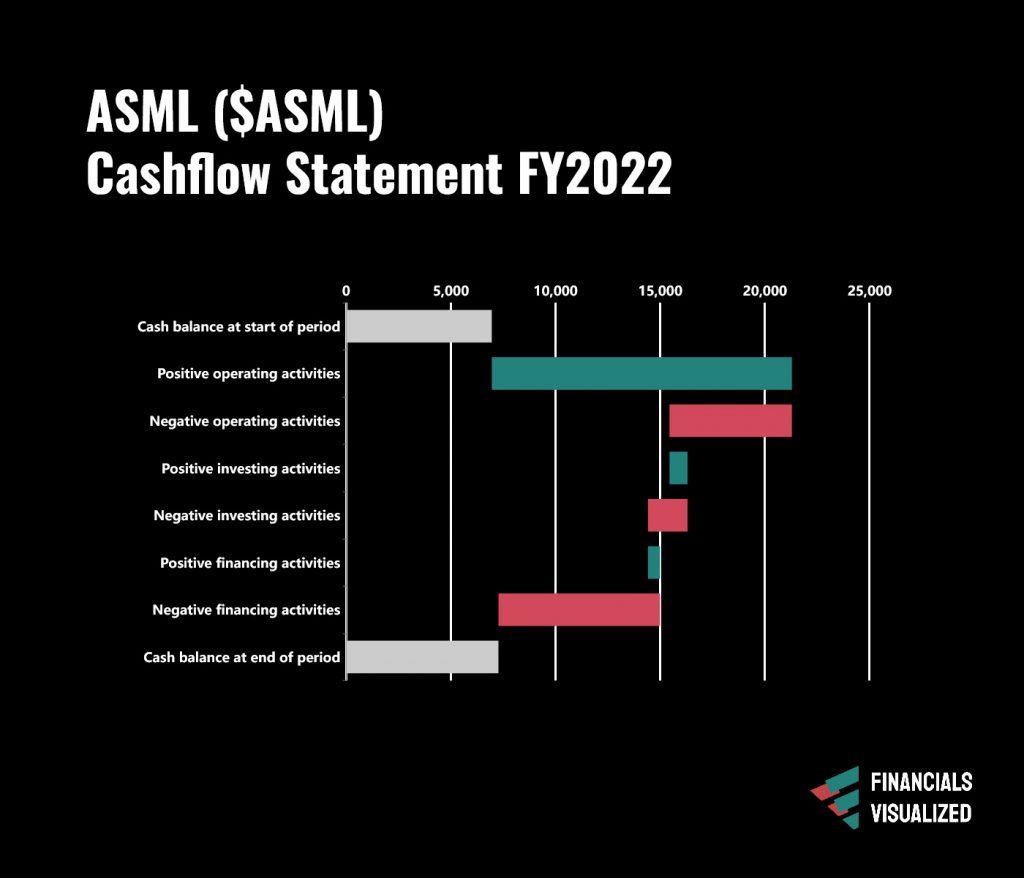
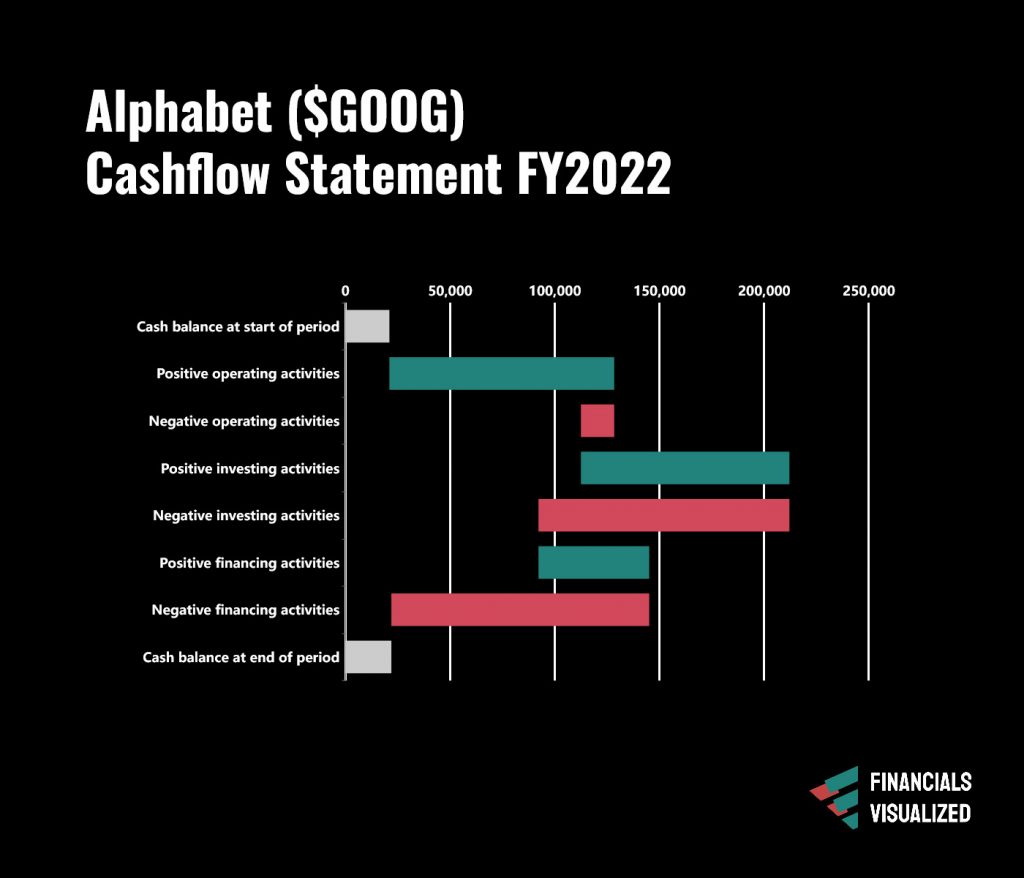
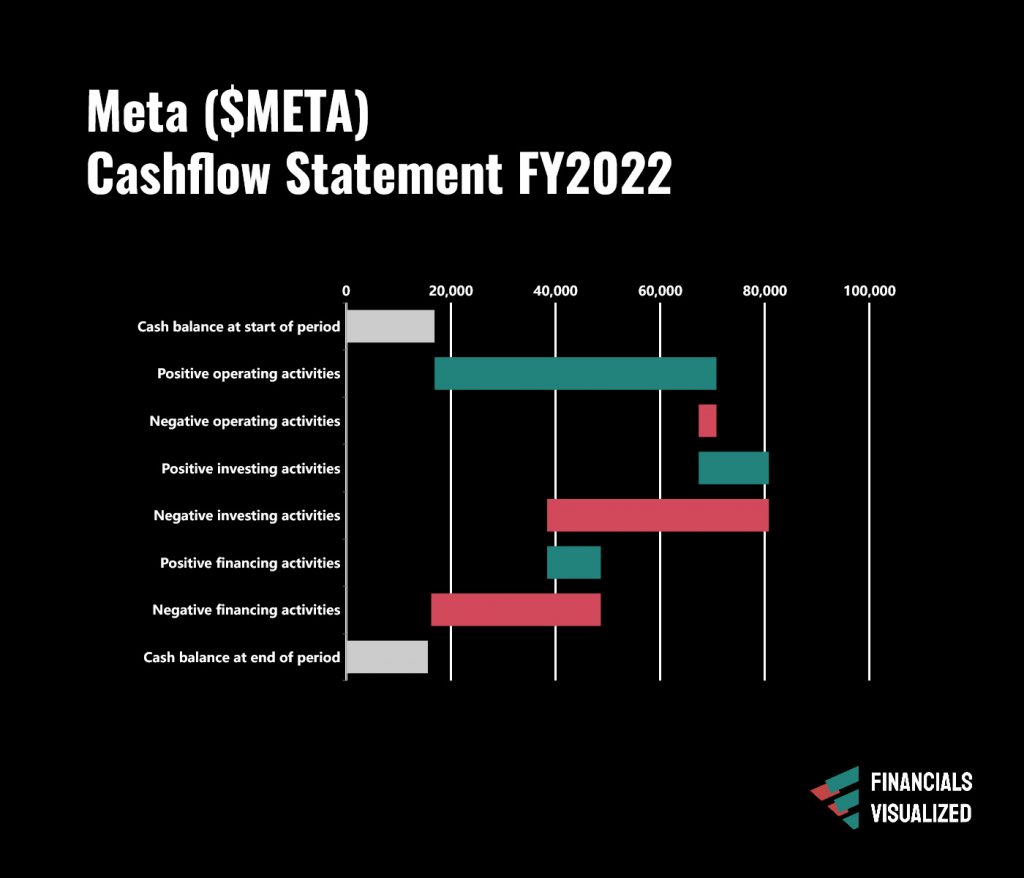
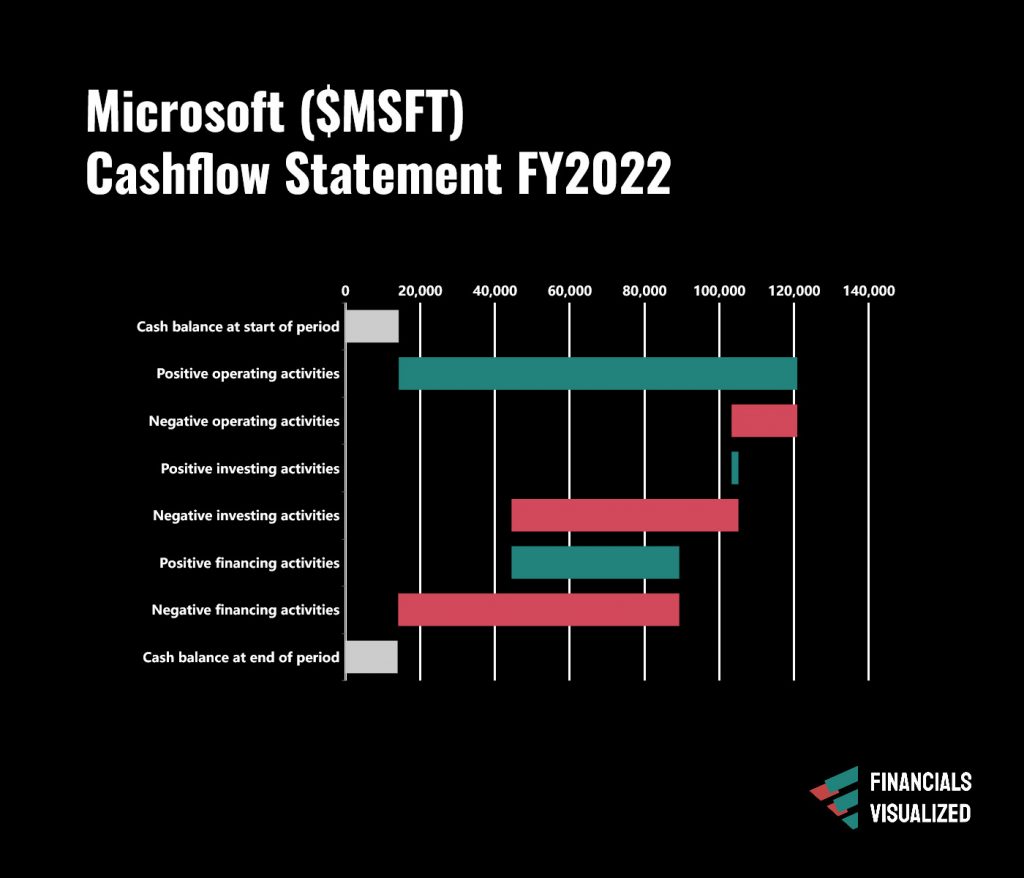
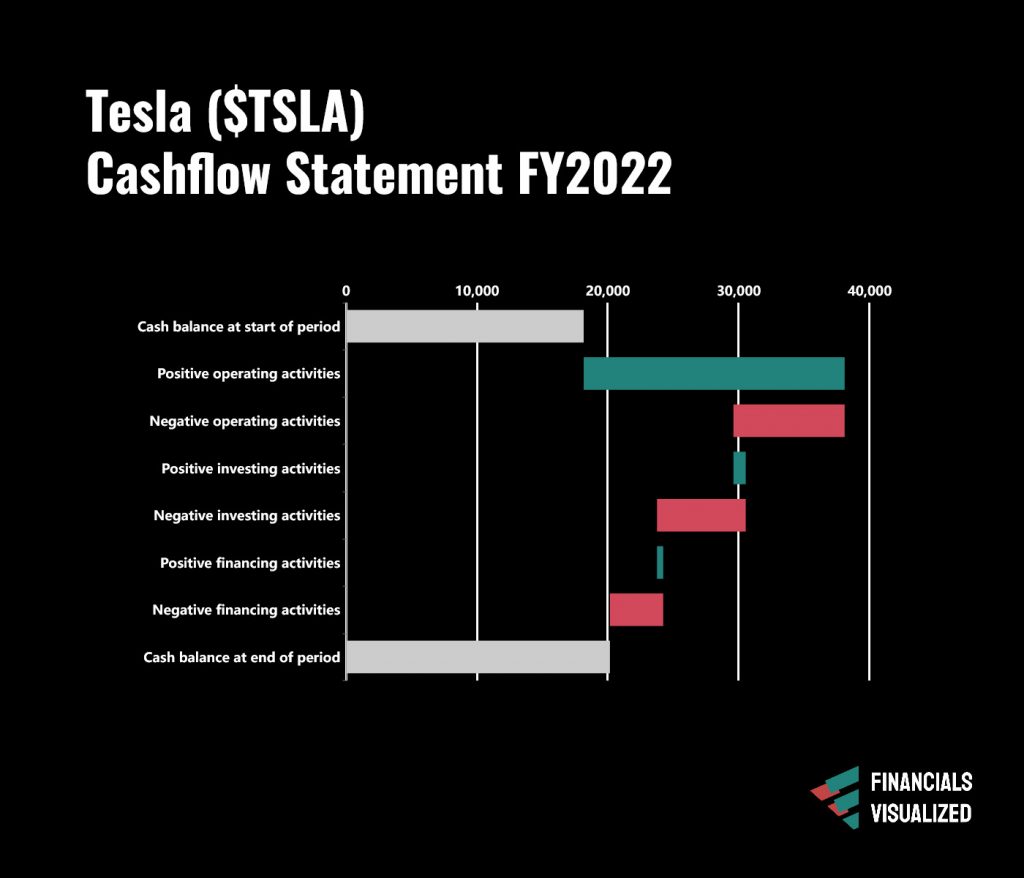
Sample Cash flow Statements
Simply put:
Save time! Make money!

No more piles of paperwork or PDFs
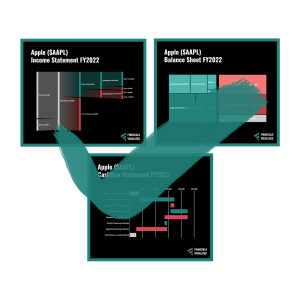
Just simple and intuitive charts
I’M SOLD!
Fill my order!
Analyst
- 100 charts/month
- Income statement visualization
- 3 years of financial data
- All markets
Vice President
- 1000 charts/month
- Income statement visualization
- Balance sheet visualization
- Cash flow statement visualization
- 10 years of financial data
- All markets
Managing Director
- Unlimited charts/month
- income statement visualization
- balance sheet visualization
- cash flow statement visualization
- 30+ years of financial data
- All markets
- Batch processing tickers, time frames and statement types
Enterprise
- Use in commericial setting
- One license for all your staff
- Unlimited queries
- income statement visualization
- balance sheet visualization
- cash flow statement visualization
- 30+ years of financial data
- All markets
- Batch processing tickers, time frames and statement types
still have a question?
FAQ
You still have questions!? Find them answered here and if you don’t, use the last entry to send us an email.
What markets do you cover?
Your content goes here. Edit or remove this text inline or in the module Content settings. You can also style every aspect of this content in the module Design settings and even apply custom CSS to this text in the module Advanced settings.
What exchanges do you cover?
Your content goes here. Edit or remove this text inline or in the module Content settings. You can also style every aspect of this content in the module Design settings and even apply custom CSS to this text in the module Advanced settings.
Besides stocks, what other financial products do you cover?
Your content goes here. Edit or remove this text inline or in the module Content settings. You can also style every aspect of this content in the module Design settings and even apply custom CSS to this text in the module Advanced settings.
What's you cancellation policy?
It’s a monthly subscription with a monthly cancelation period. You can cancel at any time. You then will be able to keep using the service until the end of the billing period (a few days or weeks).
How do I unsubscribe my email sign up?
Simply open our email to you and click the ‘unsubscribe’ button at the very end – done!
I'm red-green blind/have dyschromatopsia and can't distinguish the coloring
Let us know how much that is an issue. Know that we gladly build a coloring-feature that is much better to read in such cases.
Do the charts come in white too? I want to print!
Your content goes here. Edit or remove this text inline or in the module Content settings. You can also style every aspect of this content in the module Design settings and even apply custom CSS to this text in the module Advanced settings.
I have another question
Your content goes here. Edit or remove this text inline or in the module Content settings. You can also style every aspect of this content in the module Design settings and even apply custom CSS to this text in the module Advanced settings.

